Welcome back to the Product Spotlight series in the Beanstack Blog! Here, you’ll find news about our latest features and insights into how Beanstack’s tools can help you achieve your reading goals. Whether you’re already using Beanstack or you’re looking to build a culture of reading in your community—this series is for you.
Introducing Beanstack's Enhanced School District Dashboard Experience
Our team is always fine-tuning Beanstack to help busy educators save time and increase their impact. Recently, we’ve been hard at work researching the best user experience for administrators to motivate and monitor reading progress at schools across their district. After extensive testing and validation, we’re thrilled to release a three-part update to all school district clients’ district reporting sites: an improved reports interface, a brand-new data dashboard showing weekly, monthly, and yearly progress at all schools in the district, and a new district challenge creator to add custom district-sponsored challenges to all your schools.
Get Easy and Actionable Data Insights
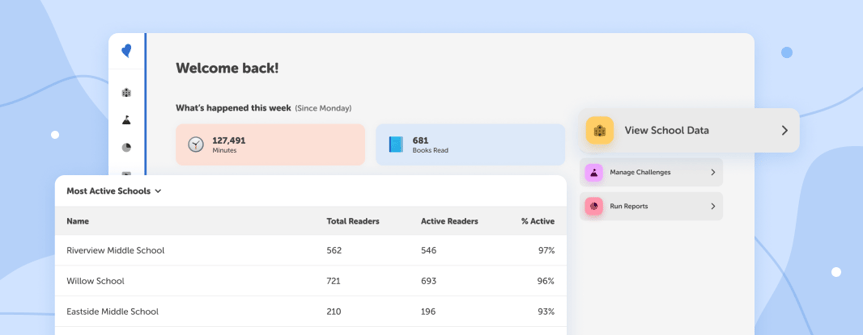
With this new enhancement, it’s even easier for district leaders to get real-time updates on reading activity and progress throughout your school district. The home dashboard to your district site now displays weekly reading statistics and school rankings for all schools in your district. You can easily change the dashboard’s sorting functionality to display the most active or least active schools for the current week, so that you can celebrate reading superstars and help struggling schools.
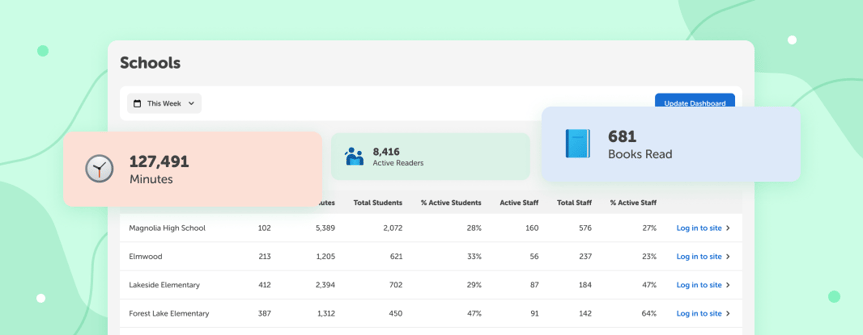
To dive deeper into specific school data insights, the new Schools section lists high-level reading statistics for every school in your district. You can filter your schools list by metrics like total minutes or the percentage of active students, as well as change the data timeframe to show reading stats by the week, month, or year. To further help tailor your support of specific school buildings, you can click next to any school in your district’s list to log into their individual site and check out their challenges, student stats, and more.
The district reports section also got a facelift to help busy administrators easily find specific data reports. You can see data broken down by schools, grade levels, teachers, or students, plus easily customize the report dates and metrics and download the data. All these data tools help you encourage reading success throughout your district and tell the story of your schools’ reading growth.
Swiftly Create and Add Challenges to All Your School Sites
The new district challenge creator lets you create and instantly publish district-wide reading challenges that drive student reading engagement. You can create a fully customized initiative for your district, including tailor-made badges, a thematic banner, and personalized reading goals, or use our library of pre-created reading challenge templates to spin up your challenge in no time. You can even add district-wide rewards to up the ante and encourage more participation.
Once you pick which grades you want enrolled in the challenge, you can easily publish the program to all schools in your district and enroll all their eligible students in one click. With all your students participating in the same challenge and working together to hit personal and community goals, your district’s reading culture will blossom.
Get Started
All existing Beanstack for Schools partners now have access to the powerful new district administrator experience on their district sites. Not a client, but looking to consolidate your school district’s reading motivation and tracking tools into one easy and quiz-free platform? Get in touch today for a demo and pricing information!