
-
Participation at a Glance
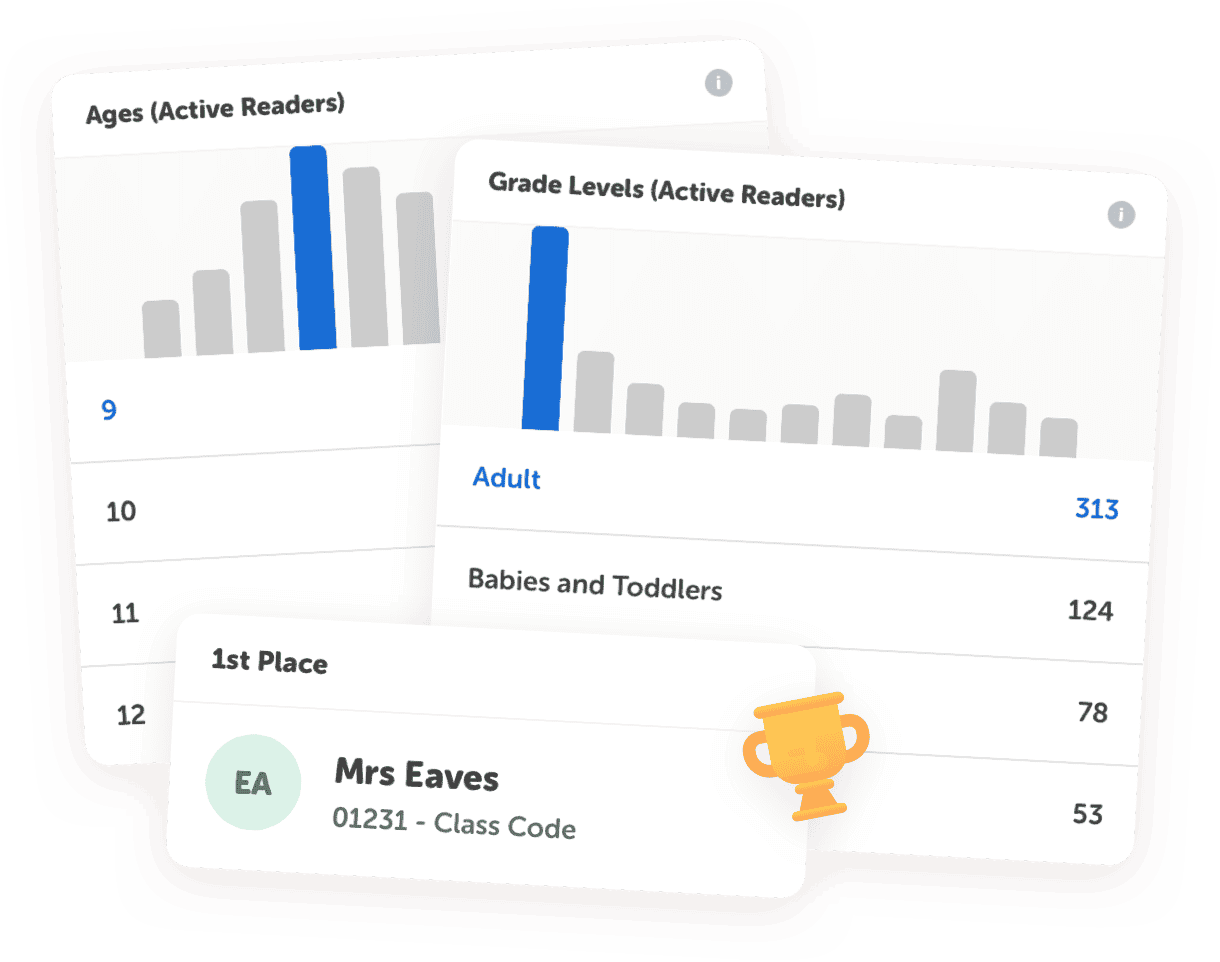
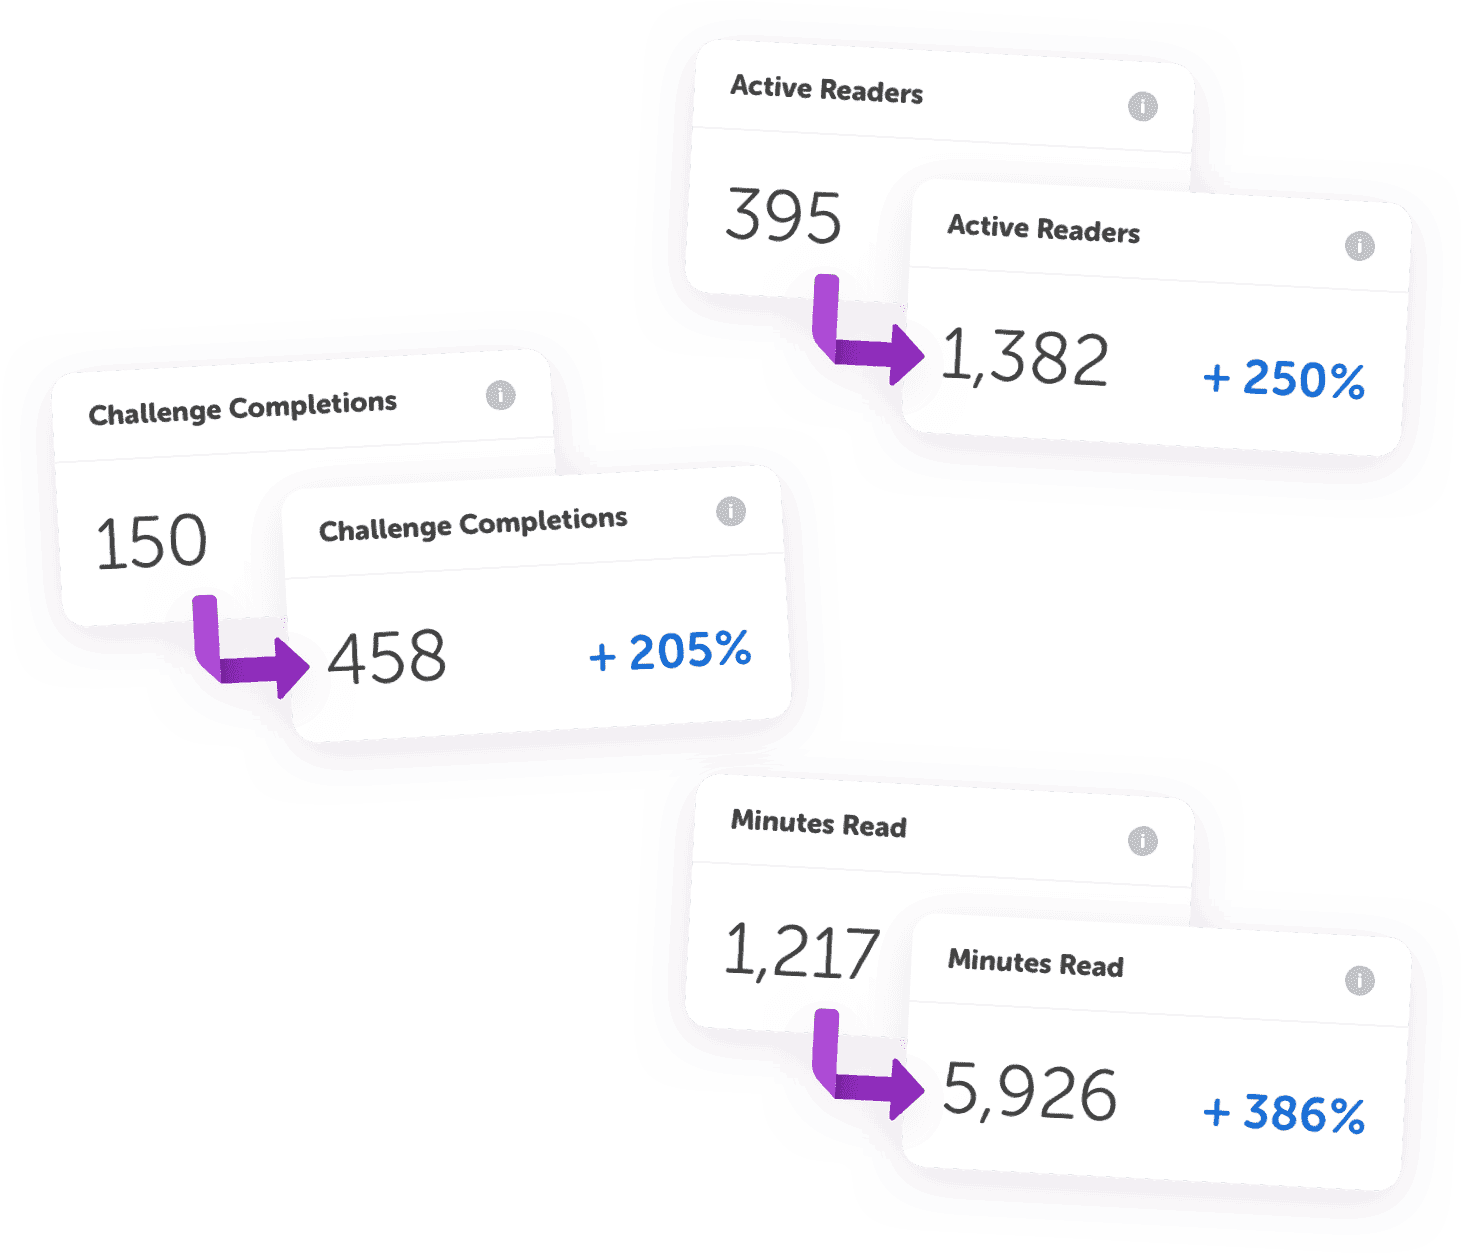
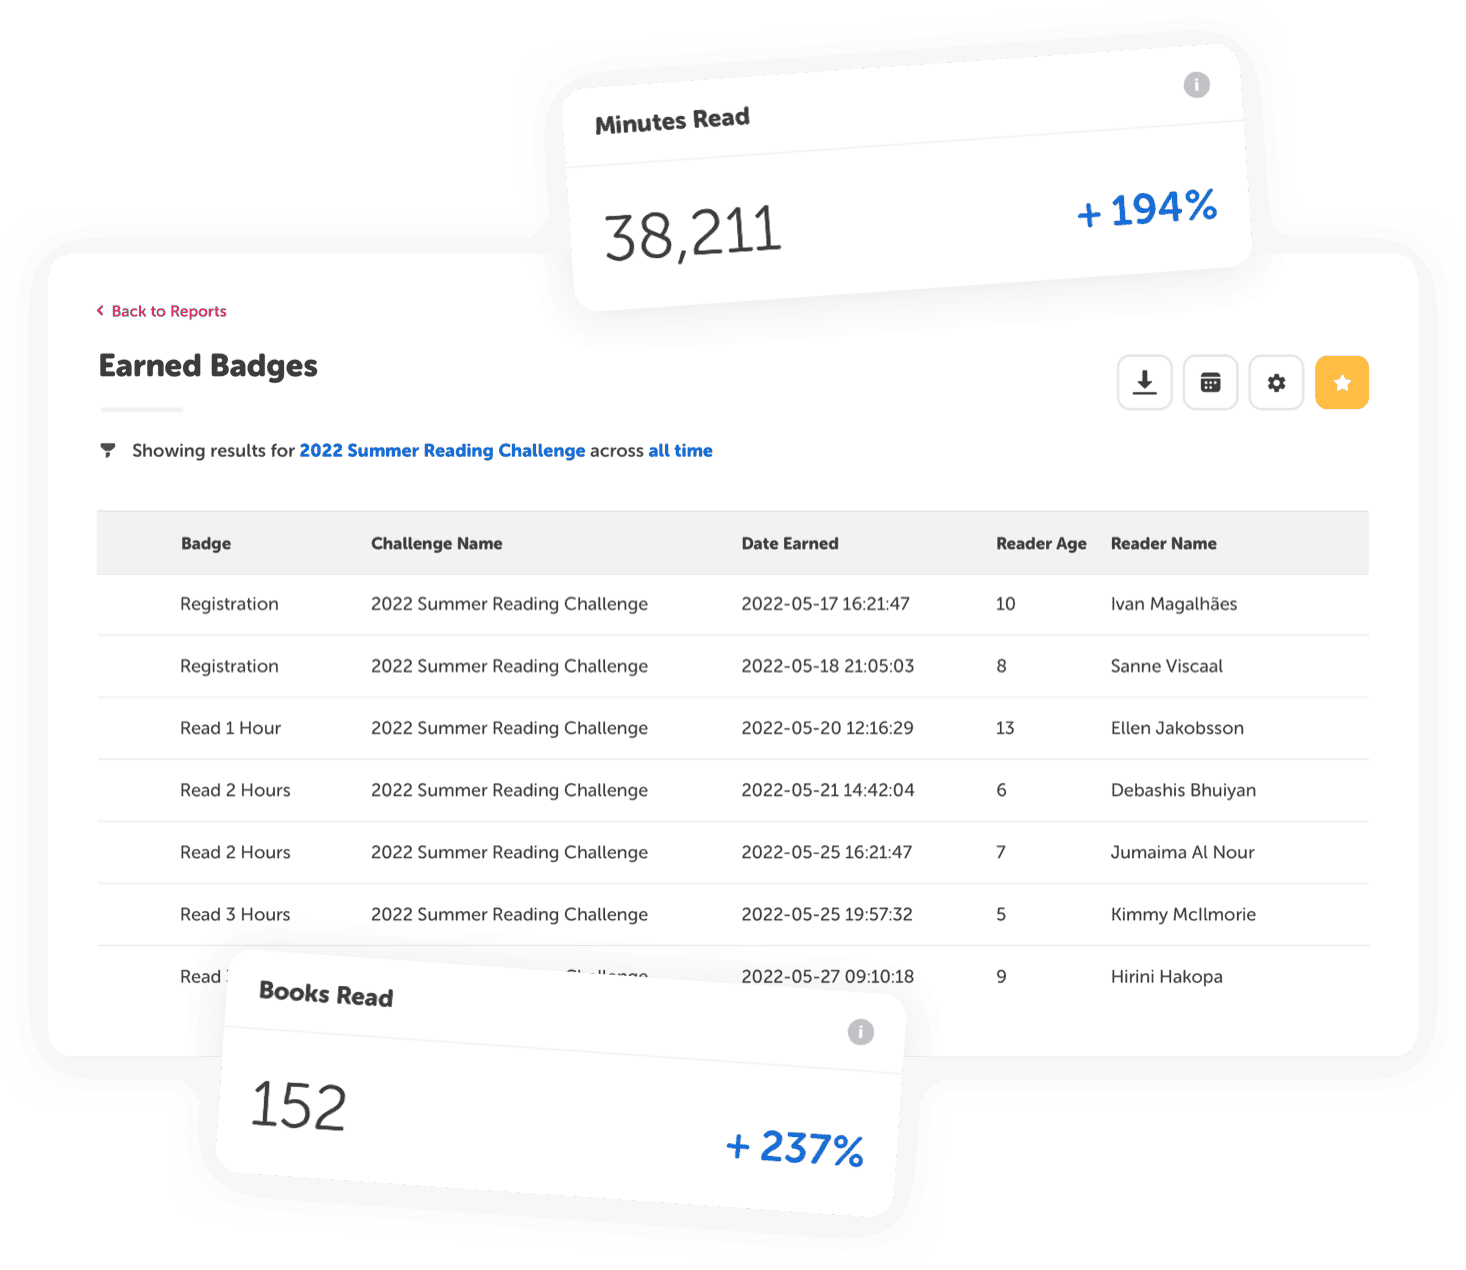
Monitor registrations, challenge activity, and reading engagement through real-time dashboards designed to keep you informed.
-
Reading Trends Over Time
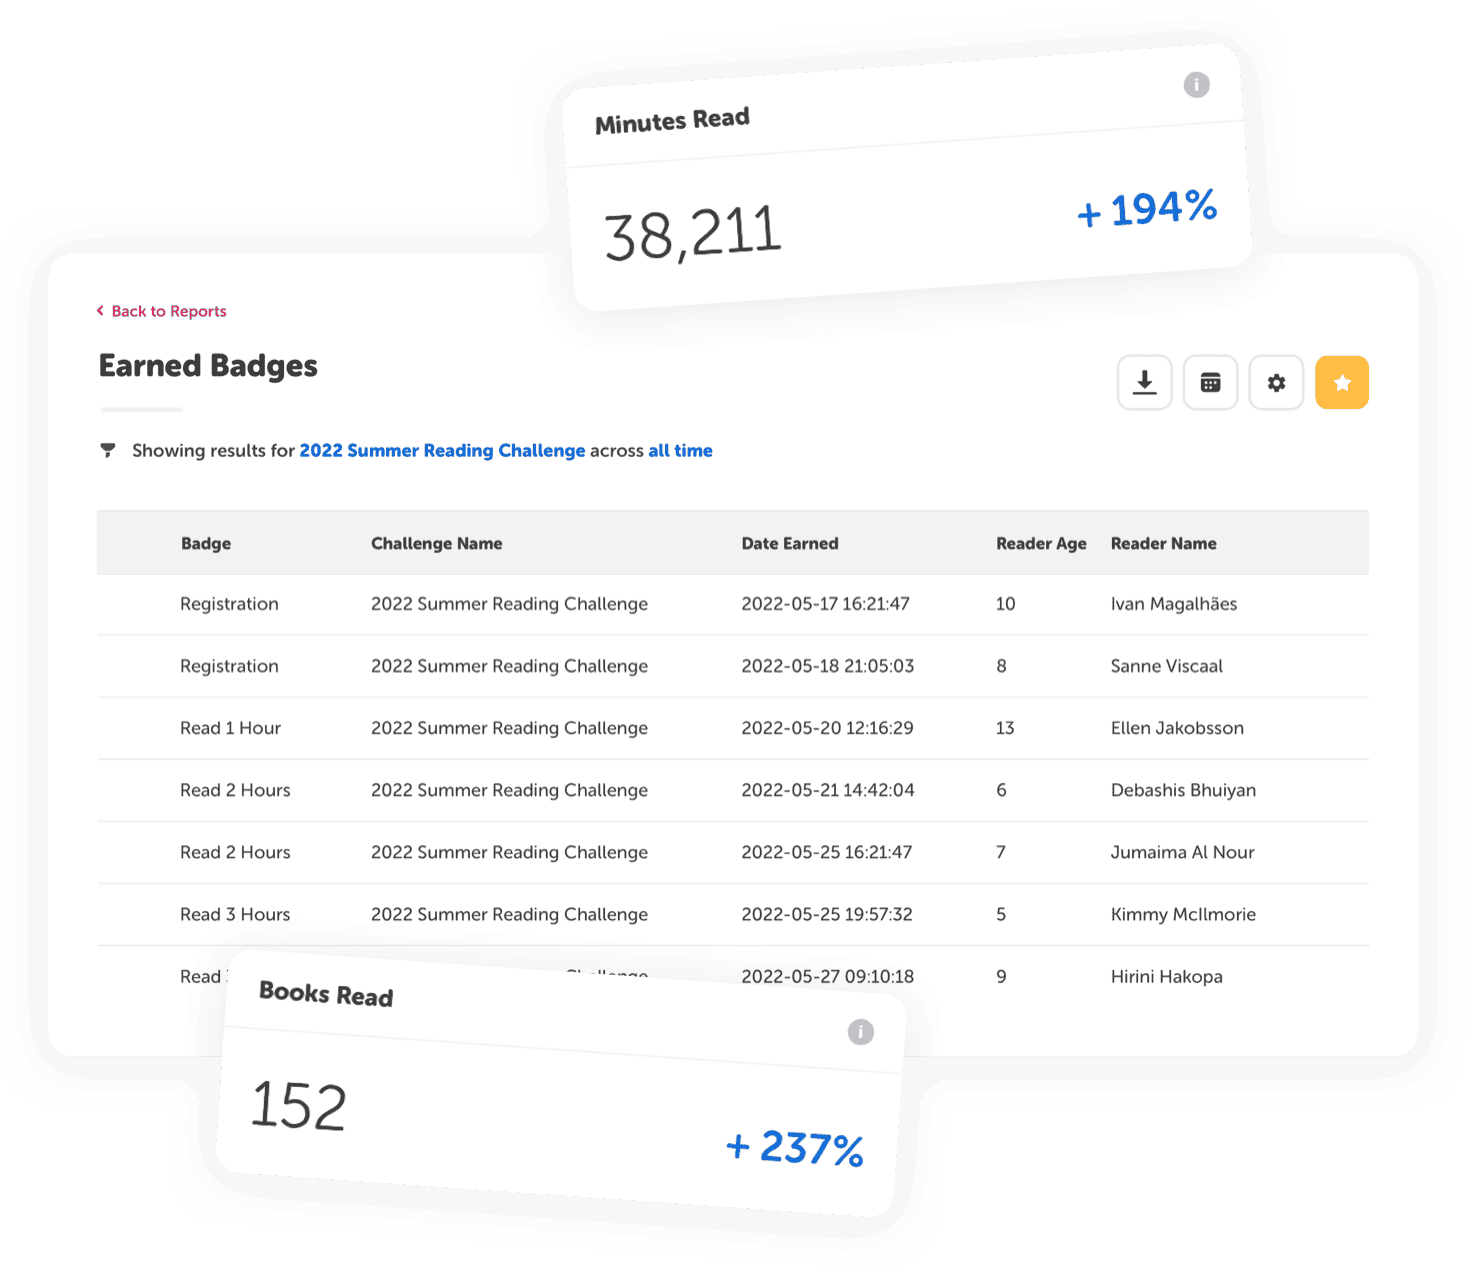
Track participation and reading activity by week, month, or year to better understand how engagement evolves.
-
Flexible Reporting
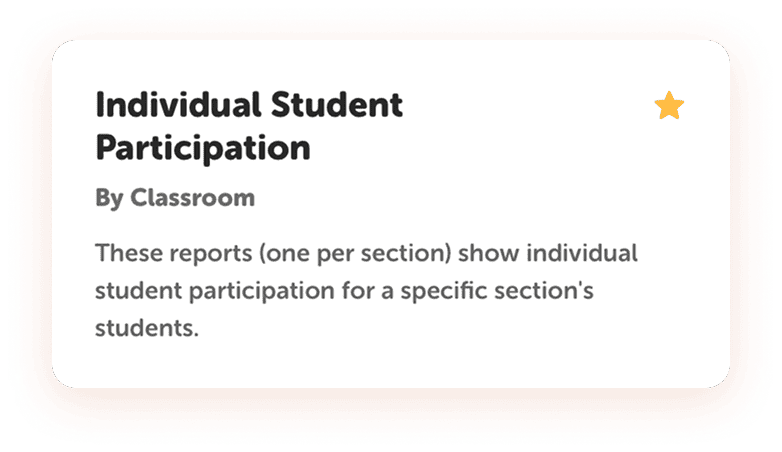
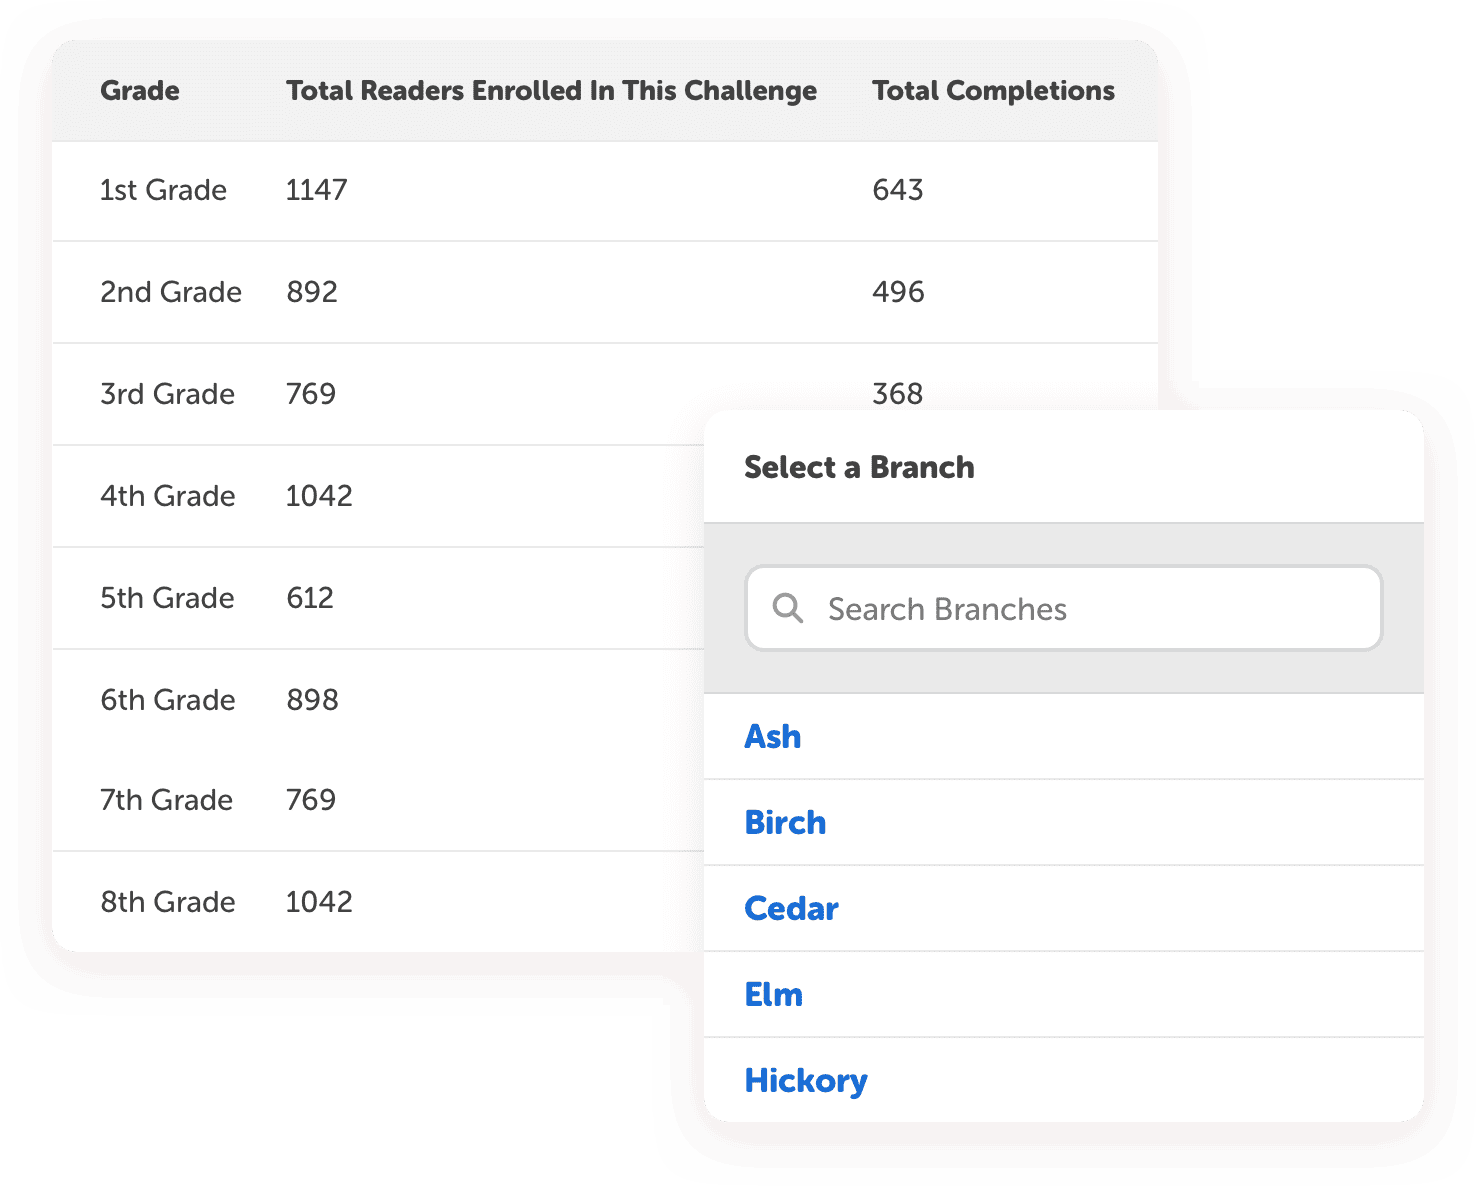
Filter reports by building, class, grade, teacher, or reader to answer your most important questions.
-
Share Your Impact
Download reports and visual summaries to celebrate success and communicate outcomes with stakeholders.
See the Story Behind Your Reading Programs
Every reader, classroom, school, and community has a story to tell. Beanstack's dashboards and reports make it easy to explore participation, spot trends, and measure progress through visual insights that support informed decisions.
Actionable Insights for Every Level
From classroom to district, Beanstack helps educators understand reading engagement and discover opportunities to encourage more reading.
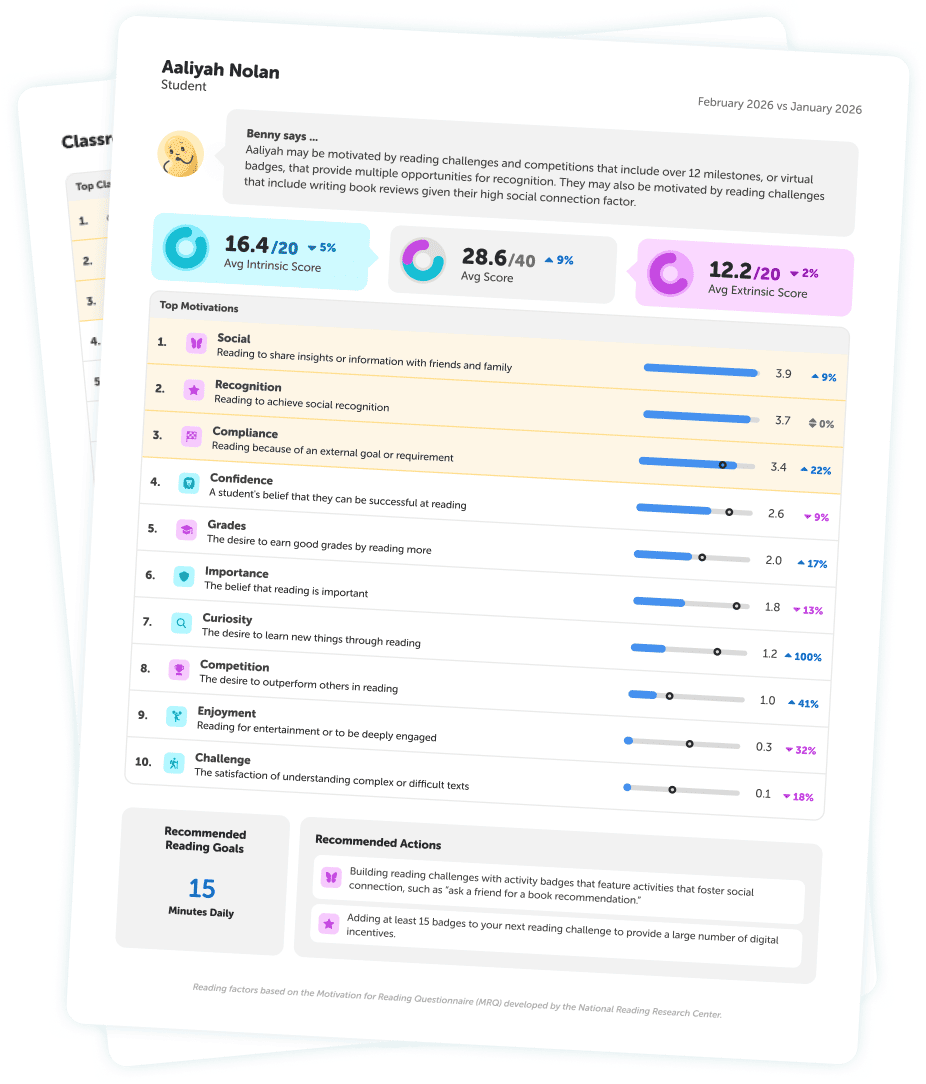
Go beyond reading activity to understand what motivates students to read. Using research-based methodology, the Reading Motivation Index helps schools measure reading motivation, identify trends across classrooms and grade levels, and uncover opportunities to strengthen student engagement.
Need quick answers? Benny's Number Cruncher transforms reading data into clear insights, helping educators identify standout readers, recognize achievements, and discover where additional encouragement may be needed, all without digging through reports.
See reading activity across every classroom and campus from one central dashboard. Monitor weekly, monthly, and yearly reading activity, compare activity across schools, and quickly see which areas celebrate success or need additional support.
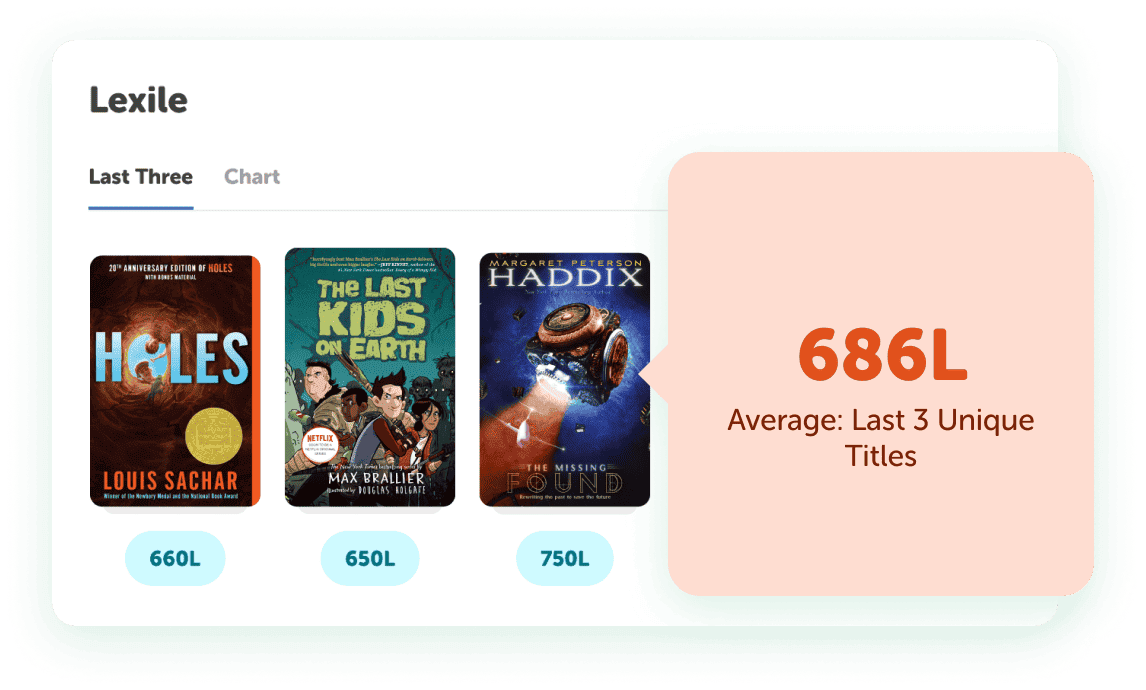
View students' independent reading habits through the books they choose. Lexile Insights helps teachers identify reading patterns, monitor growth over time, and make informed recommendations that support every reader's journey.

Turn Reading Data Into Community Impact
Beanstack helps libraries understand participation, measure community engagement, and demonstrate the value of their reading programs. From summer reading to year-round initiatives, you'll have the insights you need to advocate for your library and plan what's next.
Explore how readers participate across programs, identify trends over time, and discover what keeps your community engaged.
Create and customize reports that make it easy to answer questions and communicate outcomes with library boards, community partners, municipal leaders, and funders.
Use participation and engagement trends to evaluate programs, pinpoint areas to change, and plan future reading initiatives with confidence.
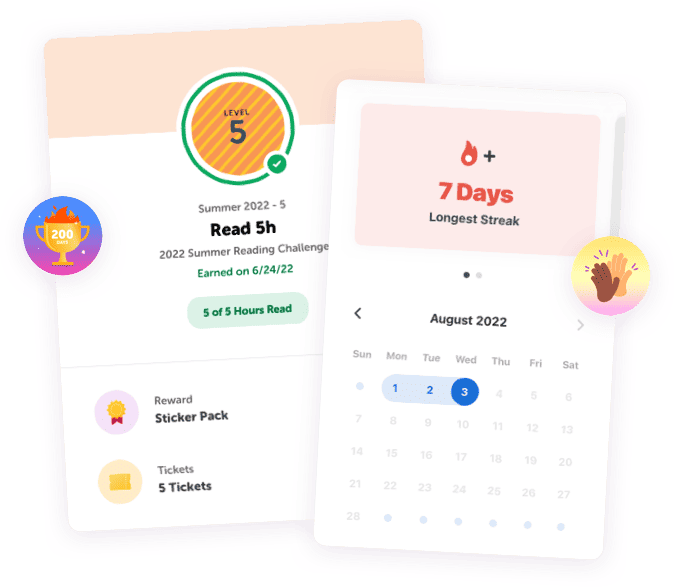
Quickly draw prize winners, recognize milestones, and celebrate readers throughout your programs with tools that make participation fun and program management simple.


FAQs
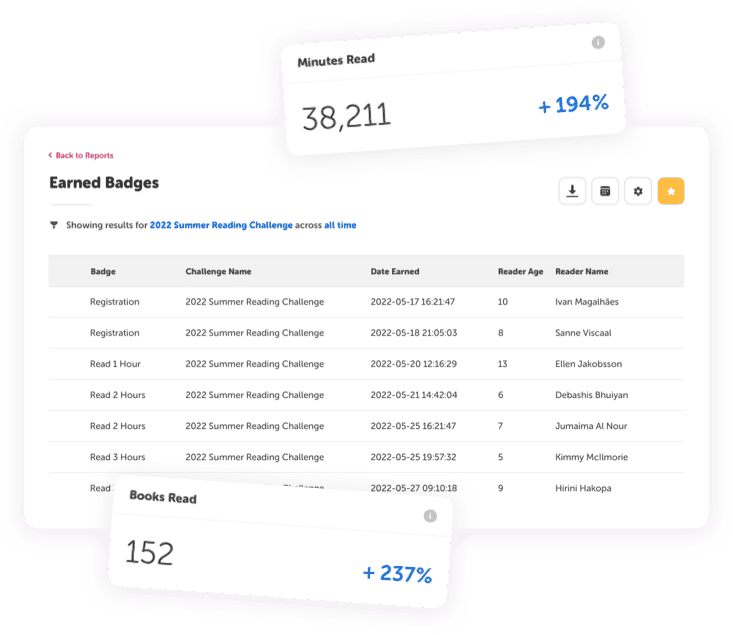
Beanstack pulls all reading activity into one streamlined admin dashboard. You can monitor active readers, minutes logged, badges earned, and more in real time without juggling spreadsheets or paper logs.
Beanstack offers a wide variety of ready-made reports and flexible tools to build custom ones. You can filter reports by school, branch, class, grade, program, time frame, or reading challenge to answer the exact questions you have about your readers.
Yes! Beanstack supports multiple levels of reporting and accountability. You can zoom out to view district- or system-wide trends, or zoom in to see a single reader's history, badges, and reading sessions over time.
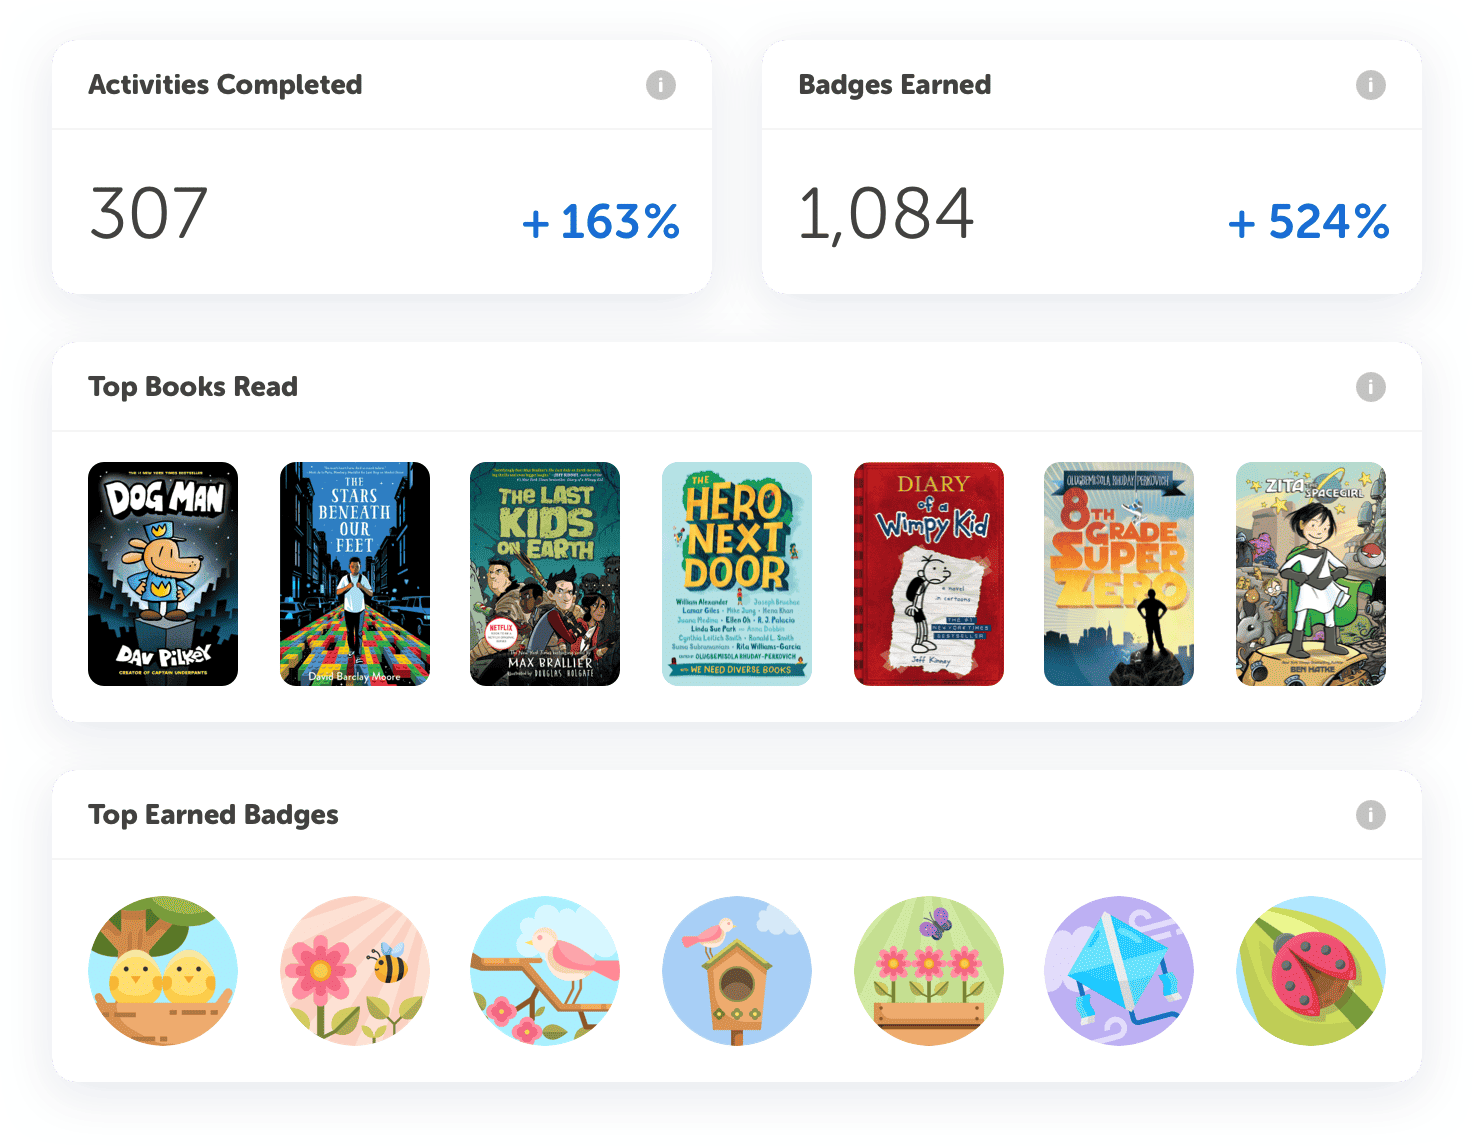
The Reading Insights tab provides visualizations for participation over time, top books, and badges earned. These charts make it easy to identify what's working, where engagement dips, and which titles or challenges are resonating with readers.
Lexile Insights translates student reading data into clear growth trends and instructional groupings. Educators use these insights to recommend just-right books, close skill gaps, and personalize reading instruction while keeping reading fun and choice-driven.
Yes! Beanstack's reports and visualizations make it easier to tell your community's reading story. You can use them for board presentations, grant applications, or district updates to highlight participation, growth, and impact across your schools or libraries.